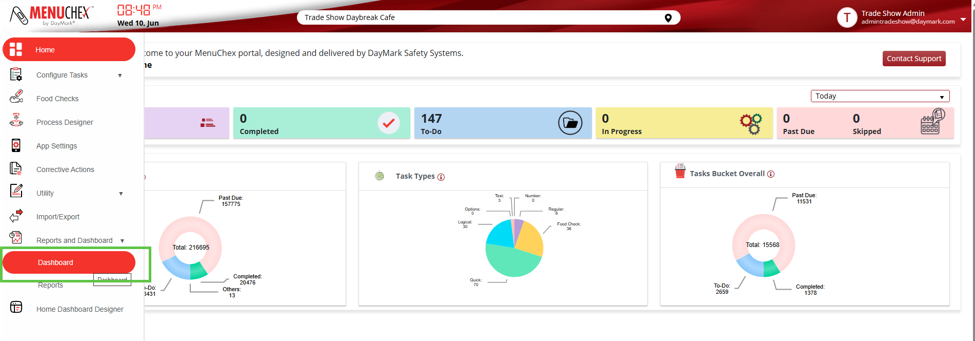
Navigation to Dashboard
Users with valid permissions can access the Reports and Dashboard from the MenuChex Portal. Select Dashboard.
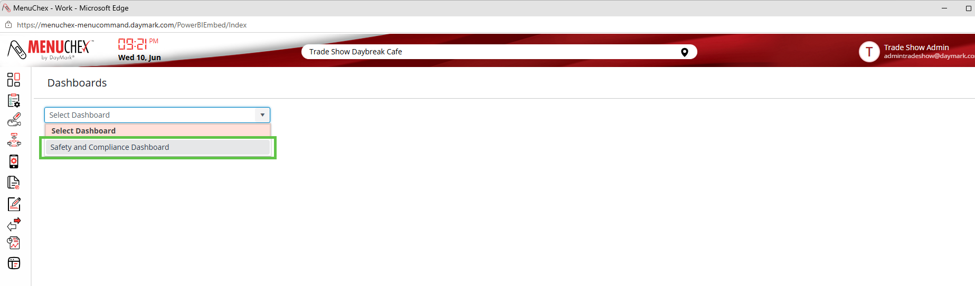
Use the drop-down menu to select the Safety and Compliance Dashboard.
Safety and Compliance Dashboard
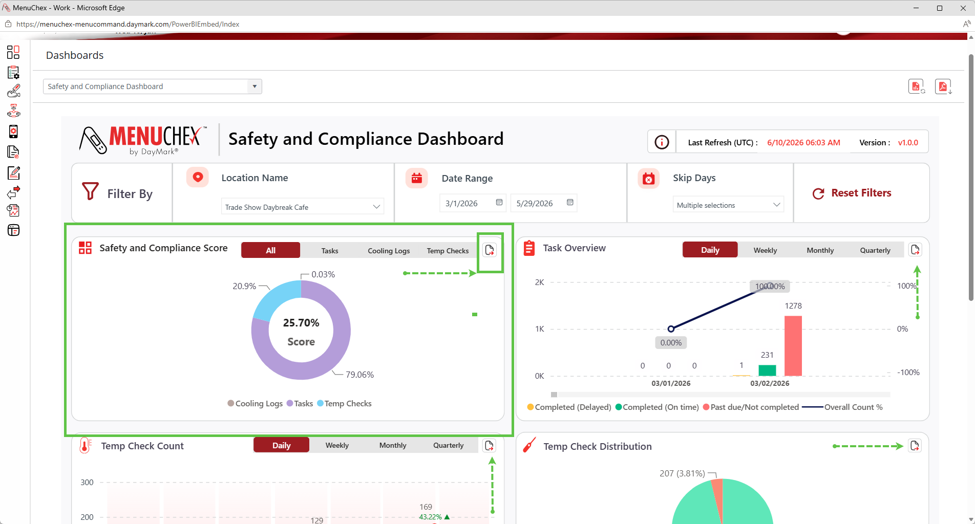
The Safety and Compliance Dashboard give a user a high level view of how their stores are performing over a given time period. The dashboard consists of specific charts such as
- Safety and Compliance Score: Summarizes operational compliance across the three major categories.
- Task Overview: Provides a time‑based visual analysis of task performance across four critical task states.
- Skipped, Past Due, Completed (Delayed), Completed (On Time)
- Temp Check Count: Visualizes the monthly volume of recorded temperature checks for selected locations and time periods.
- Temp Check Distribution: Visualizes the quality of temperature monitoring by showing the proportion of temperature checks that fall In Spec versus Out of Spec.
- Safety and Compliance Score Comparison: Provides a comparative overview of Safety & Compliance performance across multiple locations.
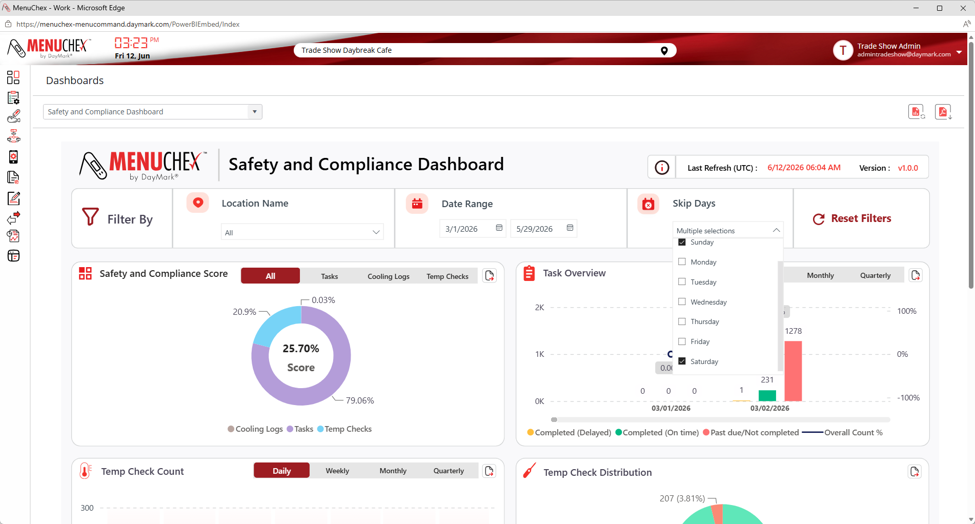
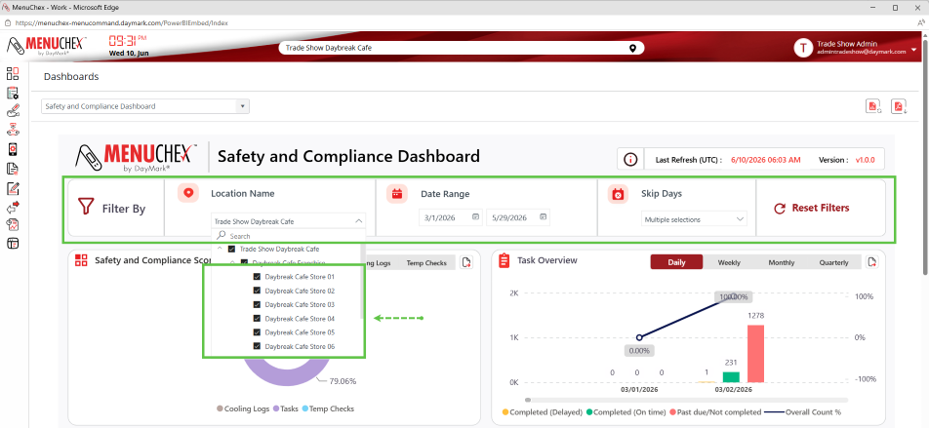
The dashboard includes a Filter panel that allows users to refine the displayed metrics.
- Filter by location, date range, skip days.
- Reset Filters button restores all filters to default settings.
- Users can filter to view location data based on their level of permissions. Corporate users will see all franchises and the stores underneath them Franchise users will see only their franchise and the stores underneath them
- Store users will see only their store.
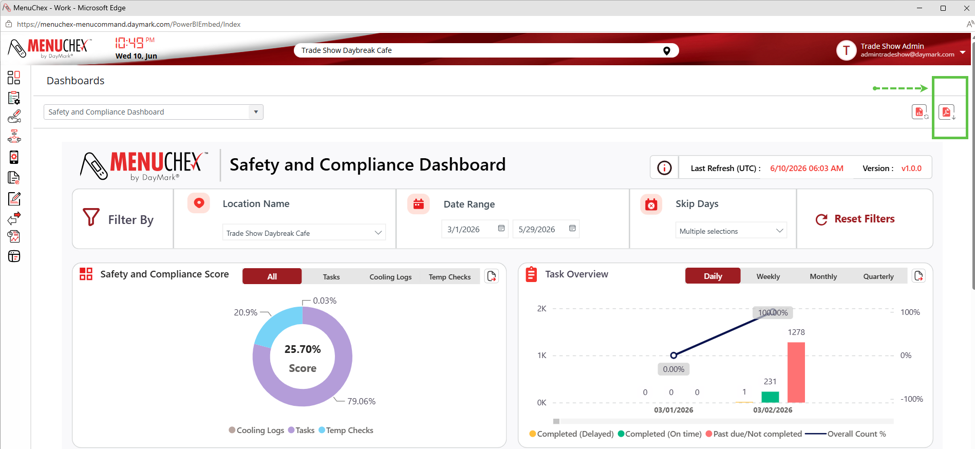
Export to PDF
Export to PDF allows you to export the entire screen into a printable PDF. The PDF will contain all data and graphs as shown on the dashboard webpage.
Export to Excel
Each chart has an export feature that allows users to drill into an excel format for deeper analysis.
When exporting dashboards, users can customize how the data is grouped by the time frame.
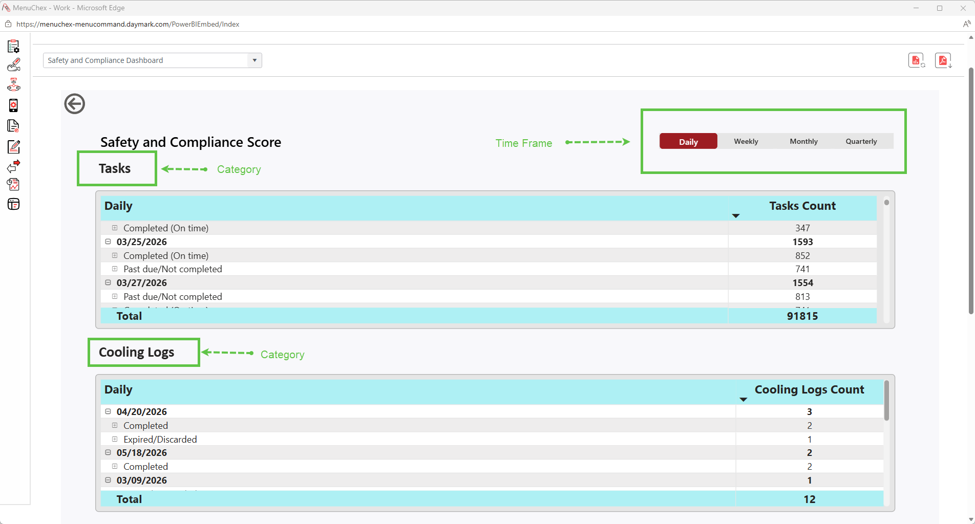
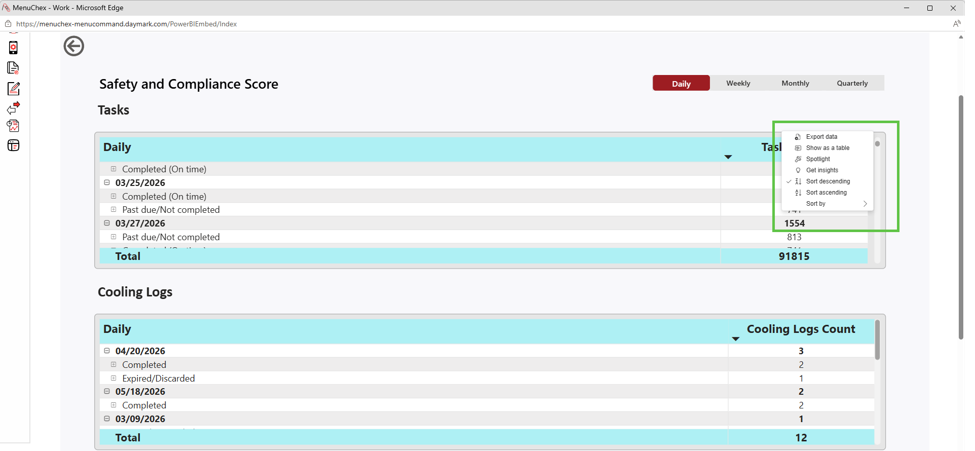
When you toggle and click the 3 dots in upper right corner of spreadsheet, several options appear, that allow a user to export into Excel, Sort, Show as Table, etc.
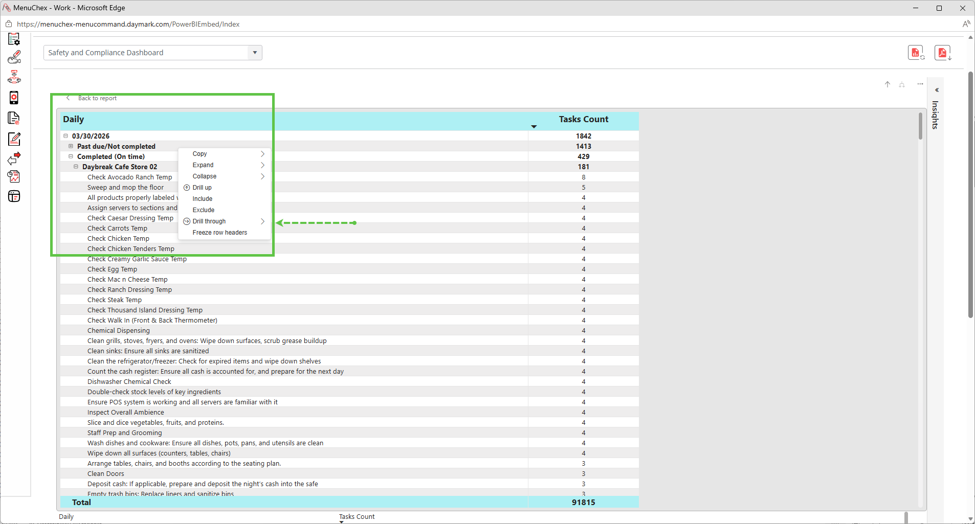
Click the + symbol to drop information to see how your stores are performing.
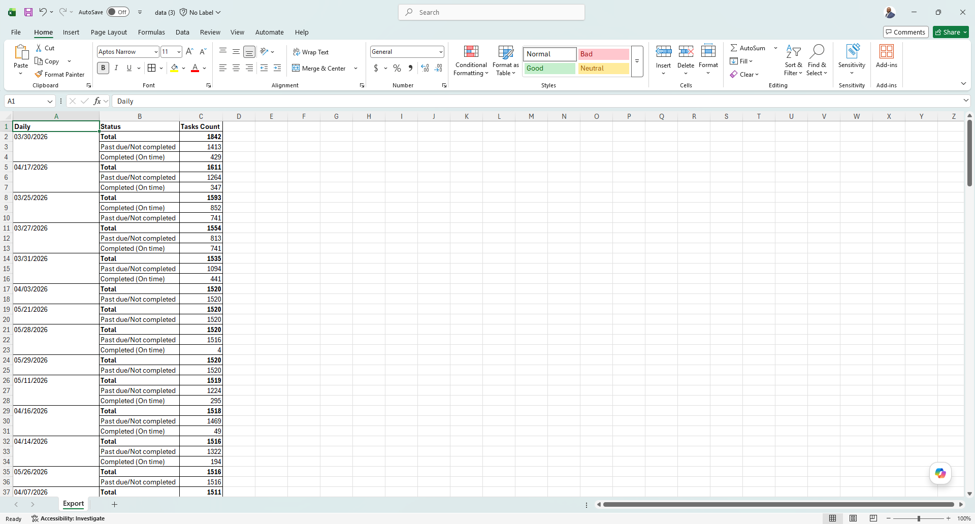
Export into Excel. Open downloaded Excel File.
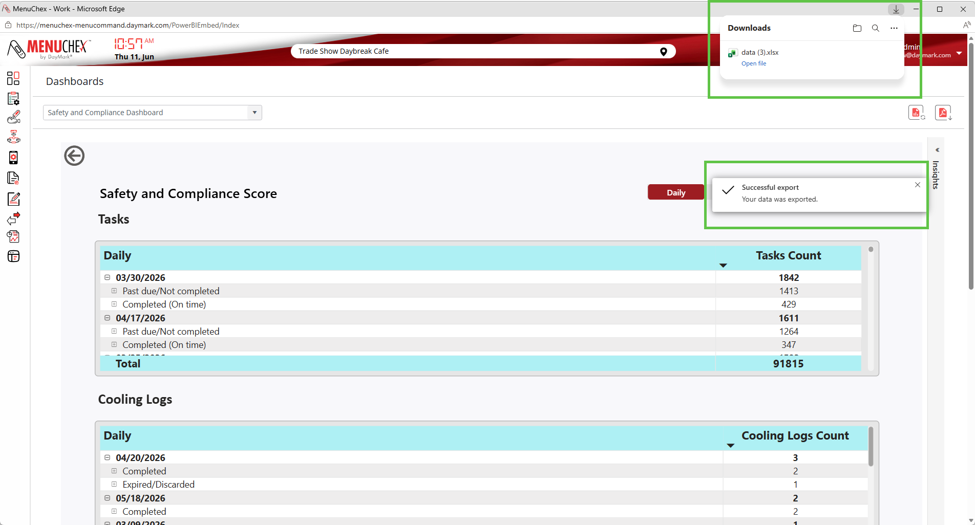
Excel file allows users to take a detailed look into what’s going on with their business. The excel file will mirror the data view that was displayed on the webpage.