The Safety and Compliance Score widget is a core analytical component of the MenuChex Safety and Compliance Dashboard. It provides a consolidated view of operational compliance across three major categories—Temperature Checks, Cooling Logs, and Tasks—by calculating category‑level success rates, failures, weighted compliance contributions, and overall system performance. The widget dynamically adapts to selected filters (Location, Date Range, Skip Days) and presents insights through a donut visualization with tab-specific breakdowns.
This includes a donut chart and breakdown by:
o Tasks
o Cooling Logs
o Temperature Checks
• The Safety and Compliance Score widget enables Operations, Corporate, Franchise, and Store stakeholders to quickly assess: o How well operational activities are being performed o Where compliance failures or delays are concentrated o What percentage of checks, logs, and tasks meet defined success conditions o How overall compliance trends shift when filters change • This widget is intended to be the primary high‑level KPI for day‑to‑day operational governance. • The widget recomputes all totals and derived metrics when: o Location changes o Date Range changes o Skip Days changes o The user switches between tabs • When users export widget data: o Exported counts should be derived based on Status following the hierarchy: Date → Status → Location → Task / Cooling Log / Temperature Checks. o must exactly match the on-screen calculations, including Skip Days adjustments and the delayed-task expired. 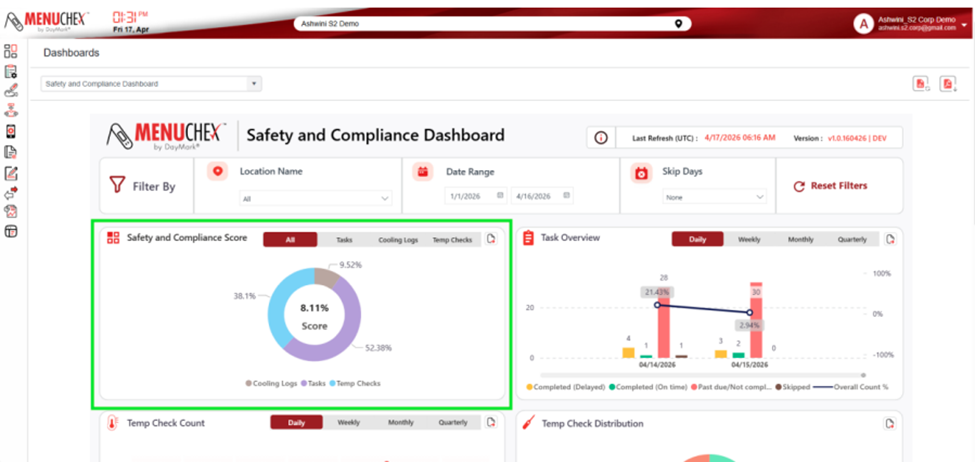 |
Category Metric Definitions • For each category (Temperature Checks, Cooling Logs, Tasks), the widget calculates: o Total count after filtering o Failure count after filtering o Success rate percentage • Division-by-Zero Handling o If any category has zero total records: o Success Rate = N/A o Weighted Sample = 0 o Donut automatically redistributes slices among remaining categories. |
Temperature Checks The score for temp checks is calculated as a percentage of the total number of temp checks out of spec (failed)/total temp checks x 100. • Total: TOTAL TEMPERATURE CHECKS TAKEN (57) • Failures: TEMPERATURE CHECKS TAKEN THAT FAILED (8) Success Formula: Temp Check Success % = max (0,1-FAILED TEMP CHECK/TOTAL TEMP CHECK) x 100 Temp Check Success % Example: (1-8/57) x100 or (1-.14) x 100 = .86 x 100 = 86% |
Cooling Logs The score for cooling logs is calculated as a percentage of the total number of cooling logs failed or expired/total cooling logs x 100. •Total = TOTAL COOLING LOGS CHECKS TAKEN (20) • Failures = COOLING LOGS THAT FAILED OR EXPIRED (2) Success Formula: Cooling Success % = max (0, 1 - FAILED / TOTAL) × 100 Cooling Success % Example: (1-2/20) x100 or (1-.1) x 100 = .90 x 100 = 90% |
Tasks The score for tasks is calculated as a percentage of the past due or not completed task (x) the completed but delayed task/total tasks. • Total: TOTAL TASKS PERFORMED (70) • Failures include: o Past Due / Not Completed (weight = 1.0) (1) o Completed but Delayed (weight = 0.5) (12) • Success Formula: Tasks Tasks Success % = max (0, 1 - (PAST_DUE_OR_NOT_COMPLETED + 0.5 × DELAYED) / TOT_TASKS) × 100 Task Success % Example: (1-1 + .5 x12)/70 x 100 or (1-.1) x 100 = .90 x 100 = 90% |
Weighted Sample (WS) Computation for Donut Chart Weighted samples represent effective compliant units: WEIGHTED SAMPLE TEMP = (Temp Success % / 100) × TOTAL TEMP CHECKS TAKEN WEIGHTED SAMPLE COOL = (Cooling Success % / 100) × TOTAL COOLING LOGS WEIGHTED SAMPLE TASK = (Tasks Success % / 100) × TOTAL TASKS PERFORMED
These values drive both: • The donut slice proportions • The All-tab visual composition Weight Sample Example: WEIGHTED SAMPLE TEMP: (86/100) x 57 = 49.02 WEIGHTED SAMPLE COOL = (90/100) x 20 = 18 WEIGHTED SAMPLE TASK = (90/100) x 70 = 63 |
Overall Success Rate Computation (All Tab) The widget adds the combined compliance score across all categories. Combined Totals TOTAL ALL = TOTAL TEMP CHECKS + TOTAL COOLING LOGS + TOTAL TASKS TOTAL ALL Example: 57 +20+70 = 147 |
Donut Chart Rendering Logic Donut Composition on All Tab Slices reflect each category’s weighted sample contribution: SUM OF WEIGHTED SAMPLE = WEIGHTED SAMPLE TEMP + WEIGHTED SAMPLE TASK + WEIGHTED SAMPLE COOL Temp Slice % = WEIGHTED SAMPLE TEMP / SUM OF WEIGHT SAMPLE Task Slice % = WEIGHTED TASK / SUM OF WEIGHTED SAMPLED Cooling Slice % = WEIGHTED COOL / SUM OF WEIGHTED SAMPLE Donut Chart Rendering Logic SUM OF WEIGHTED SAMPLE: 49.02 +18+63 = 130.02 Temp Slice %: (49.02/130.02) = 37.7% Task Slice %: (18/130.02) = 13.8% Cooling Slice %: (63/130.02) = 48.4% |
Overall Weighted Avg Score This will give weighted percentage and is the ultimate overall score that shows how you are performing. Your organization will determine what percentage is acceptable. Overall WEIGHTED SAMPLE = WEIGHTED SAMPLE TEMP + WEIGHTED SAMPLE TASK + WEIGHTED SAMPLE COOL/TOTAL ALL Overall Weight Avg Score: (49.02 +18+63 /147) = (130.02/147) = 88% |